Bill's "How Would You Clean This Data" Challenge
February 25, 2020 - by Bill Jelen

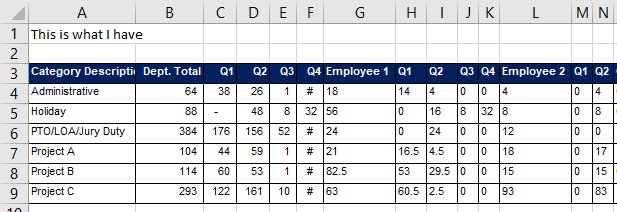
When I do a live Power Excel seminar, I offer that if anyone in the room ever has an odd Excel problem, they can send it to me for help. That is how I came to receive this data cleansing problem. Someone had a summary worksheet that looks like this:

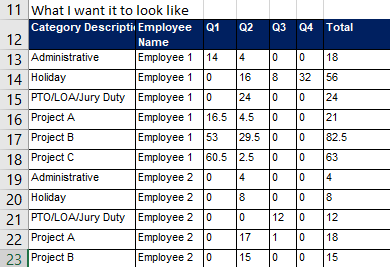
They wanted to reformat the data to look like this:

One interesting clue about this data: The 18 in G4 appears to be a subtotal of H4:K4. It is tempting to remove columns G, L, and so on but first you have to extract the employee name from G3, L3, and so on.
It was 4AM on Sunday February 9th when I turned on the video recorder and recorded some clunky steps in Power Query to solve the problem. Given that it was Sunday, a day that I don't normally do videos, I asked for people to send in their ideas of how to solve the problem. 29 solutions have been sent in.
Each solution offers some cool new improvement over my process. My plan is to start a series of articles that shows the various improvements to my method.
Watch Video
Before I start that process, I invite you to see my solution:
And the M-code that Power Query generated for me:
let
    Source = Excel.CurrentWorkbook(){[Name="UglyData"]}[Content],
    #"Promoted Headers" = Table.PromoteHeaders(Source, [PromoteAllScalars=true]),
    #"Changed Type" = Table.TransformColumnTypes(#"Promoted Headers",{{"Category Description", type text}, {"Dept. Total", type number}, {"Q1", type number}, {"Q2", type number}, {"Q3", type number}, {"Q4", Int64.Type}, {"Employee 1", type number}, {"Q1_1", type number}, {"Q2_2", type number}, {"Q3_3", Int64.Type}, {"Q4_4", Int64.Type}, {"Employee 2", Int64.Type}, {"Q1_5", Int64.Type}, {"Q2_6", Int64.Type}, {"Q3_7", Int64.Type}, {"Q4_8", Int64.Type}, {"Employee 3", Int64.Type}, {"Q1_9", Int64.Type}, {"Q2_10", Int64.Type}, {"Q3_11", Int64.Type}, {"Q4_12", Int64.Type}, {"Employee 4", type number}, {"Q1_13", type number}, {"Q2_14", type number}, {"Q3_15", type number}, {"Q4_16", Int64.Type}}),
    #"Unpivoted Other Columns" = Table.UnpivotOtherColumns(#"Changed Type", {"Category Description"}, "Attribute", "Value"),
    #"Split Column by Delimiter" = Table.SplitColumn(#"Unpivoted Other Columns", "Attribute", Splitter.SplitTextByEachDelimiter({"_"}, QuoteStyle.Csv, false), {"Attribute.1", "Attribute.2"}),
    #"Changed Type1" = Table.TransformColumnTypes(#"Split Column by Delimiter",{{"Attribute.1", type text}, {"Attribute.2", Int64.Type}}),
    #"Removed Columns" = Table.RemoveColumns(#"Changed Type1",{"Attribute.2"}),
    #"Renamed Columns" = Table.RenameColumns(#"Removed Columns",{{"Attribute.1", "TextValue"}}),
    #"Added Custom" = Table.AddColumn(#"Renamed Columns", "Length", each Text.Length([TextValue])),
    #"Added Conditional Column" = Table.AddColumn(#"Added Custom", "Name", each if [Length] > 2 then [TextValue] else null),
    #"Filled Down" = Table.FillDown(#"Added Conditional Column",{"Name"}),
    #"Reordered Columns" = Table.ReorderColumns(#"Filled Down",{"Category Description", "Name", "TextValue", "Value", "Length"}),
    #"Filtered Rows" = Table.SelectRows(#"Reordered Columns", each ([TextValue] = "Q1" or [TextValue] = "Q2" or [TextValue] = "Q3" or [TextValue] = "Q4")),
    #"Filtered Rows1" = Table.SelectRows(#"Filtered Rows", each [Name] <> "Dept. Total"),
    #"Removed Columns1" = Table.RemoveColumns(#"Filtered Rows1",{"Length"}),
    #"Pivoted Column" = Table.Pivot(#"Removed Columns1", List.Distinct(#"Removed Columns1"[TextValue]), "TextValue", "Value", List.Sum),
    #"Sorted Rows" = Table.Sort(#"Pivoted Column",{{"Name", Order.Ascending}}),
    #"Added Custom1" = Table.AddColumn(#"Sorted Rows", "Total", each [Q1]+[Q2]+[Q3]+[Q4])
in
    #"Added Custom1"
Before we start getting in to the solutions, let's address a lot of common comments:
- Some of you said you would go backwards to figure out why the data is showing up in this format to begin with. I appreciate these comments. Everyone who said this is a better person than I am. I have learned over the years that when you ask "Why?" the answer usually involves this former employee who started down this path 17 years ago and everyone keeps using it this way since we are all used to it now.
- Also – many of you – said the final solution should be a tall vertical table and then use a pivot table to produce the final results. Jonathan Cooper summarized this best: "I also agree with some of the other YouTube comments that a proper data set wouldn't have "Totals" and wouldn't have need to be pivoted at the end. But if the user really wants a plain old table then you give them what they want." I can actually see both sides of this. I love a pivot table and the only thing more fun than Power Query is Power Query with a nice pivot table on top. But if we can do the whole thing in Power Query, then one less thing to break.
Here are Hyperlinks to Various Techniques
-
Power Query Techniques
-
Moving Beyond the Power Query Interface
-
Formula Solutions
-
Composite of all Ideas from Above and Final Video
