
Overcome Excel's 65536 Limit
October 10, 2005
To try this tip on your own computer, download and unzip CFH274.zip.
Excel offers 65,536 rows of data on a single spreadsheet. What happens when you have more data than this? Many people turn to Access – but the great news is that you can use that Access data and still do Excel Pivot Tables on the data to produce quick summary reports.
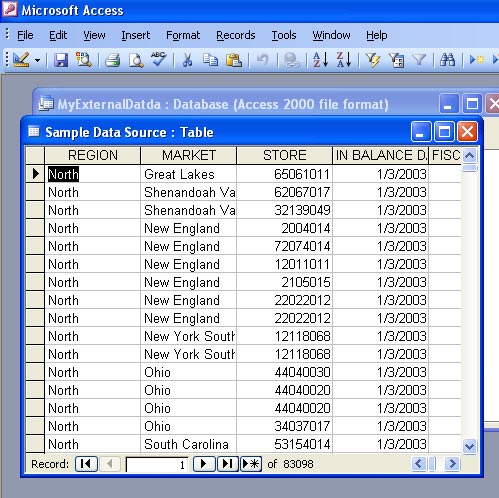
You have a table in Access with 83,000 rows of data. This is more data than can be captured in a single Excel 2003 worksheet.
Start with a blank Excel workbook. From the Data menu, select PivotTable. If you are using Excel data, you can usually click right through steps 1 & 2 of the Wizard. In this case, you have to change the settings. From the data menu, select PivotTable and PivotChart.
In Step 1 of the Wizard, select External Data.

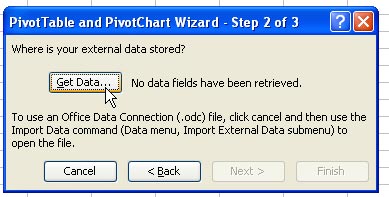
In step 2, click the Get Data button.
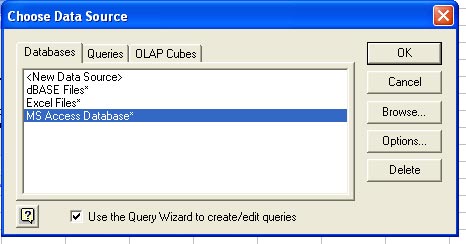
Choose an Access database.
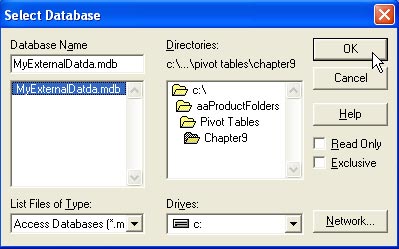
This ancient-looking Open dialog shows that you are now actually running Microsoft Query instead of Excel. Browse to your database.
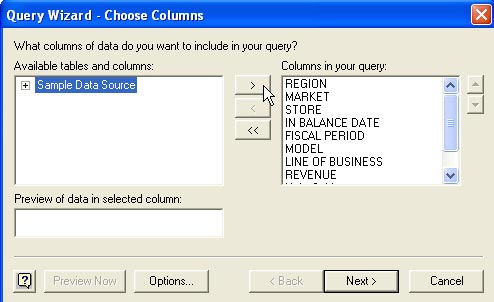
A list of tables appears on the left. Choose a table, and press the arrow button to move the fields to the right.
In the next 2 steps, you could filter the data or change the sort order. Just click Next through these. Choose to return the data to Microsoft Excel.
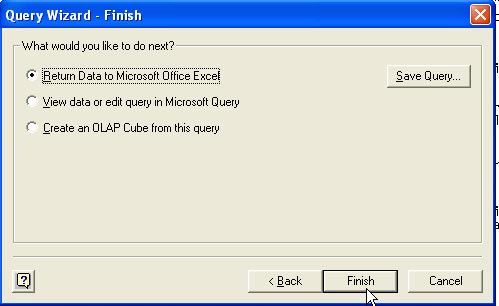
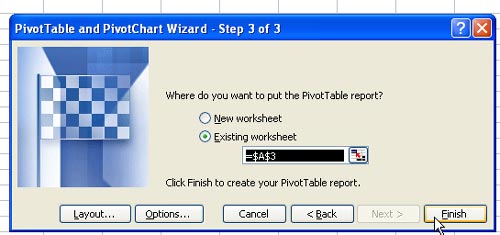
You are finally taken back to Step 2 of the Pivot Table Wizard. Choose Next. Click Finish in step 3 of the Wizard.
You now have a blank pivot table.
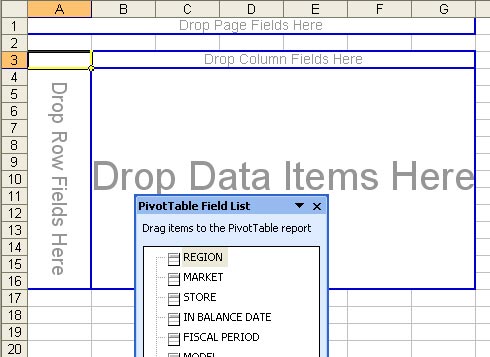
You can drag fields from the pivot table field list to various sections of the pivot report to create a summary report.
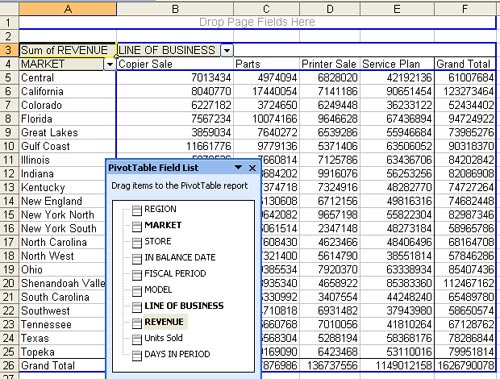
Storing your data in Access allows you to use Excel's most powerful feature - pivot tables - to analyze your data.
The tip in this show is from Pivot Table Data Crunching.